


Unlocking the Power of On-Demand Cohort Analysis
Maximize insights with on-demand cohort analysis. Uncover trends, enhance decision-making, and optimize strategies for sustained business success.
Table of Contents

Unlocking the Power of On-Demand Cohort Analysis
- Time-based – cohorts that are analyzed based on the time of user acquisition.
- Segment-based – cohorts where users are grouped based on shared characteristics or behaviors.
- Size-based – cohorts that are categorized based on specific quantitative criteria.
Importance of Cohort Analysis
Here’s a look at importance of cohort analysis:
Customer segmentation
Cohort analysis enables businesses to perceive unique behavioral patterns and preferences within specific market segments, offering insights that might be overlooked when monitoring overall performance. By understanding segment responses to GTM activities, businesses can personalize outreach messaging and the customer acquisition process, tailor products and services and optimize the customer lifecycle journey. This approach fosters customer satisfaction and loyalty, enhances competitive differentiation, and ultimately leads to improved market positioning and sustained business growth.
Win-loss analysis
It provides businesses with a deep understanding of win rate fluctuations, enabling a comprehensive evaluation of diverse market segments. It highlights variations between regions like the US and EMEA, as well as differences in performance between small-to-medium businesses and large enterprises. This analysis also uncovers the influence of specific competitors on product win rates and opportunity progression through the sales funnel. Equipped with these insights, businesses can make well-informed decisions about their ideal customer profile (ICP) and tune their GTM strategy based on that.
Lead generation
Enables the customization of demand generation strategies based on specific group behaviors within the customer base. By identifying unique preferences and purchasing patterns through this analysis, businesses can create targeted marketing campaigns that resonate with the distinct needs of each customer cohort, fostering increased engagement and brand loyalty. Additionally, the flexibility offered by cohort analysis allows businesses to adapt their GTM strategies in response to evolving customer preferences and market trends, ensuring a competitive edge and sustained growth in the long run.
Budget optimization
Helps businesses optimize budget allocation by identifying the most responsive customer segments to specific go-to-market (GTM) activities, enabling efficient resource allocation and maximizing return on investment (ROI). This targeted approach streamlines customer acquisition efforts, ensuring that resources are directed towards areas with the highest potential for revenue generation. By tailoring campaigns and experiences to these segments, businesses can enhance customer engagement and loyalty, thereby maintaining a competitive edge in the market.
Product analytics
Allows businesses to examine product usage patterns among different customer segments, providing valuable insights for informed product development. By understanding how various cohorts interact with specific features or services, businesses can anticipate evolving customer needs and align their product offerings accordingly. Incorporating these insights into the product development process enables businesses to tailor features and services to meet the specific demands of different customer segments, fostering higher customer satisfaction and loyalty. Additionally, cohort analysis helps businesses identify areas for product improvement, allowing them to proactively address customer pain points and enhance the overall user experience.
How to Use Cohort Analysis
Cohort analysis involves visual representation of how specific user groups evolve in terms of important metrics over a defined period. Companies typically monitor monthly retention rates by categorizing cohorts based on sign-up dates, facilitating comparative assessments. The time-based cohort is a prevalent method for segmenting cohorts, offering valuable insights into behavioral trends across different time frames.
There are 2 ways of utilizing cohort analysis to effectively process and analyze the data:
The Traditional Way
Data Extraction and Preparation
The process begins with extracting raw data from the GTM tool and exporting it into spreadsheet software, enabling further manipulation and analysis. Additional attributes for relevant entities such as leads, opportunities, campaigns or accounts are then integrated, in order to facilitate a comprehensive understanding of customer behavior.
Segmentation of User Data
Next, the user data is segmented into different cohorts based on specific criteria, such as the lead source, engaged campaigns, region, account size, industry, sales rep, product used, customer satisfaction level, etc. This segmentation enables the comparison of different customer groups to identify specific trends and patterns. The challenge is in understanding which cohort grouping is relevant for the issue at hand, so it becomes important to segment across as many groups as possible.
Measurement of Time Intervals
After the segmentation, the time intervals between significant customer events are measured to calculate various life cycle stages. This step helps in understanding how long it takes for customers to progress through different stages of their interaction with the product or service.
Visualization and Analysis
Once all of the necessary cohort data is pulled together, RevOps analysts build pivot tables and graphs to create visual representations that GTM leaders then manually scour through in order to develop a comprehensive understanding of the relationships between different cohorts. These visualizations assist in calculating the aggregation of multiple dimensions of user data, providing insights into the overall performance of the cohorts and enabling data-driven decision-making. Given the resource constraints of typical analyst teams, this process can take a while, ranging from a few days to a couple of weeks.
Challenges with Traditional Cohort Analysis
As can be seen, this approach is very cumbersome and resource-intensive. Considering analyst teams are typically over-burdened and under-resources in most organizations, this is often the reason why most organizations simply skip cohort analysis altogether. Even when cohort analysis is performed, it is unfortunately only valid for that specific time period. The next time the analysis is needed, the whole process has to be repeated all over again.
Modern Way
Modern revenue analytics tools enable sophisticated cohort analysis through process mining, data analytics, and AI/ML integration. By visualizing how specific cohorts have historically responded to different go-to-market (GTM) channels over specific time periods, these tools provide insights into customer behavior and GTM effectiveness. Process mining helps understand the customer journey, while data analytics identifies trends and assesses marketing strategies. AI/ML capabilities enable predictive analysis, optimizing GTM strategies and enhancing customer interactions. The use of intuitive visualizations aids revenue leaders in deriving actionable insights for informed decision-making.
BigLittle Revolutionizes Cohort Analysis for Targeted Segments
At BigLittle, we are helping define and build this future of RevOps. Our flagship solution RevenUp is a revenue optimization solution for RevOps teams across marketing, sales and customer success operations and has a number of capabilities designed to simplify the process of cohort analysis for revenue teams.
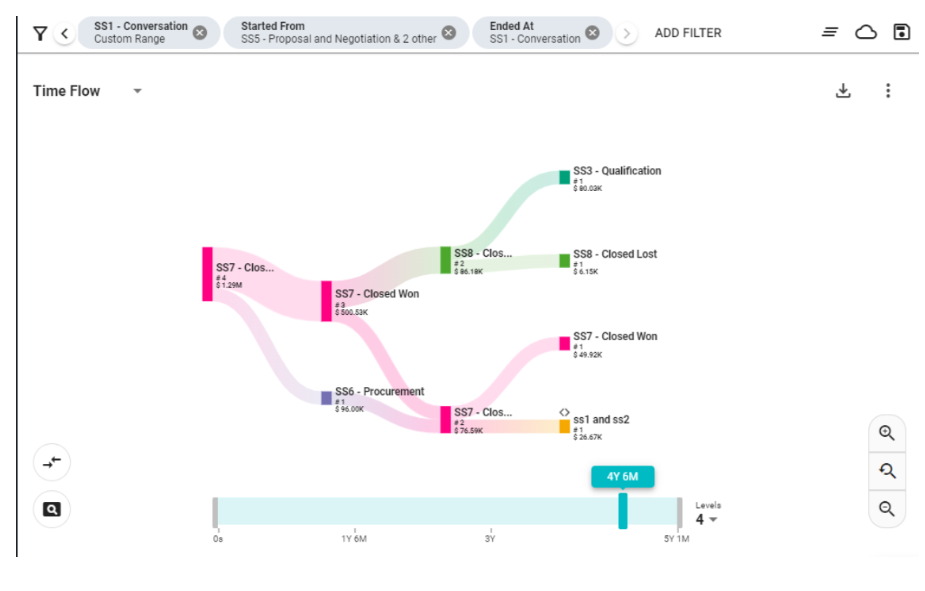
RevenUp’s “Time Flow” feature enables users to observe the progression of cohorts over time, applied to leads and opportunities. It facilitates the visualization of how many opportunities or leads remain in a particular stage or transition to another stage over set time intervals. The inclusion criteria for these opportunities or leads are based on their creation or closure within defined time frames. Similarly, the ‘Timeline’ feature allows users to select a desired time range using a slider, displaying the entire data present within the dataset. Furthermore, the ‘Levels’ function permits users to choose a specific number of steps, which are evenly distributed across the timeline, providing a uniform time interval between each level.
Get in touch with us today!